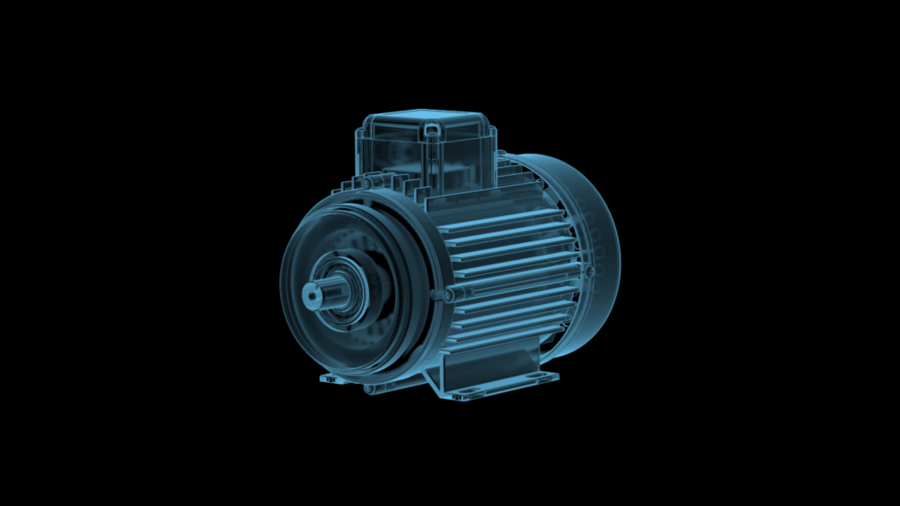
For the testing of these e-drives, we implemented the data acquisition solution and evaluation for a large German automotive supplier. Power consumption and speed are relevant to evaluating the efficiency of electromechanical systems. Since the motors are permanently installed into vehicle body parts, often only the electrical current and voltage signals are all that’s available for quality testing.
Using the Current Signal to Determine Motor Speed
In a classic DC motor, the mechanical commutator leads to a brief drop in the current curve when poles are reversed. Depending on the design and number of poles of the motor, the quantity of current dips corresponds to one revolution. This model is also reflected in the current curve of brushless motors with electronic commutation.
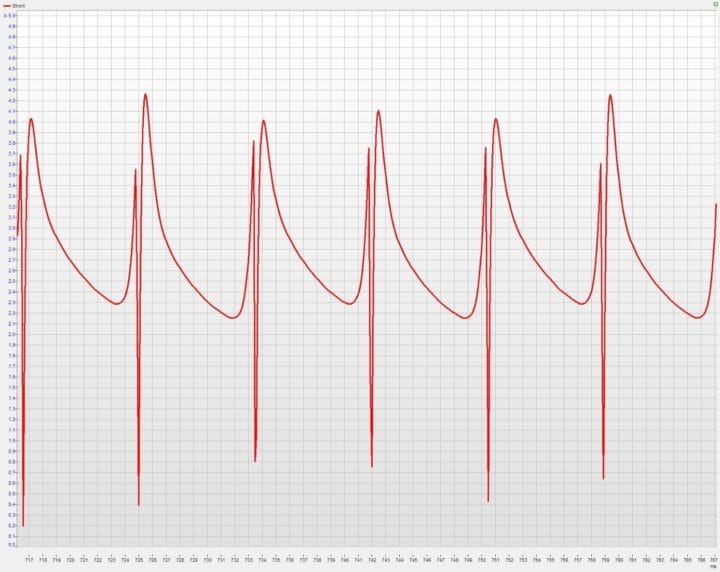
Figure 1 demonstrates the current curve of a motor over time. The current pictured here was measured with a Q.bloxx XL A107 I/O module and a shunt. The current drops visible in this example occur during commutation at intervals of 8.4 ms.
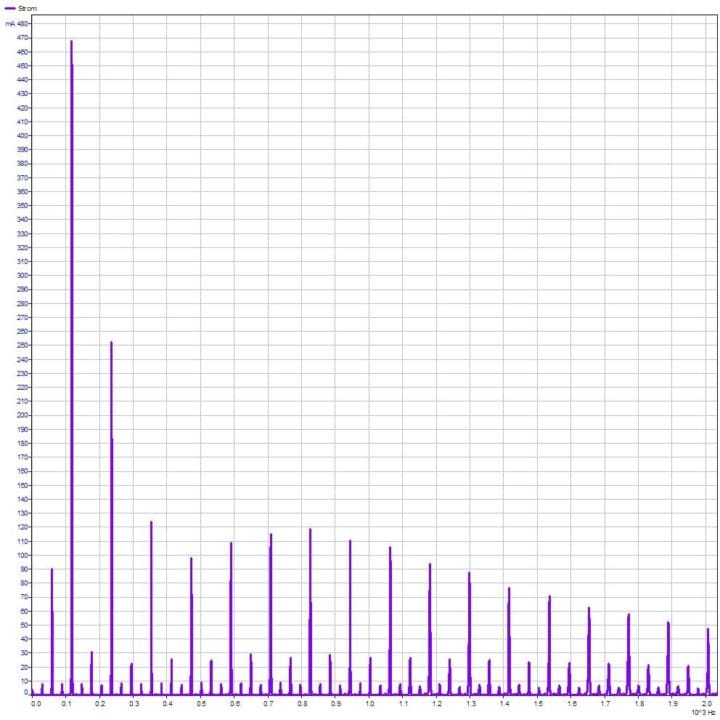
Accordingly, the spectrum of the current curve (Figure 2) shows its maximum occurs at 119 Hz. Assuming 3 commutations per revolution, this corresponds to a speed of 2380 revolutions per minute.
The spectrum can be performed both online and offline by Q.series X controllers. In this way, the engine speed can be determined continuously and live on the test bench using the current signal. The necessary configuration is performed in just a few steps.
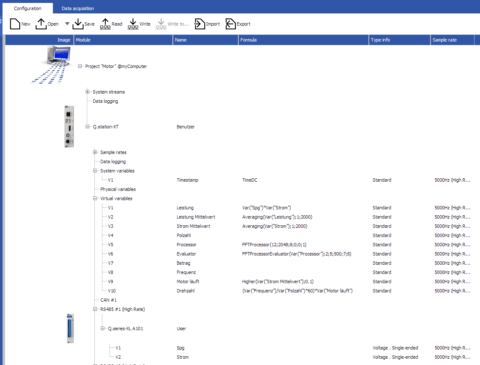
Quick-and-Easy Configuration on the Test Bench
The FFT function of the Q.series X controller offers, among other things, the possibility to evaluate the maximum of a spectrum within a selected frequency band by magnitude and frequency. The frequency of the maximum corresponds to the fundamental wave and is divided by the number of poles and multiplied by 60 to give the speed in revolutions per minute (rpm). Also, the current is used to detect whether the motor is in operation and whether the electrical power can be calculated.
This edge computing allows the motor speed to be determined without a separate computer.
Depending on the test bench configuration, data can now be transferred to the system control, e.g., via EtherCAT or visualized within GI.bench on the test bench PC or over the local network.
Simply Powerful Visualization
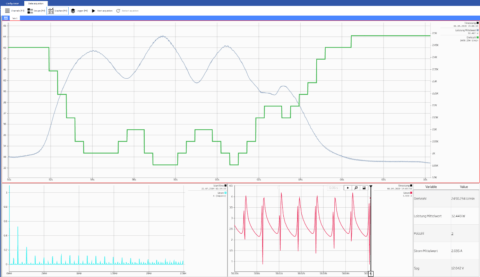
With GI.bench, you can create custom dashboards for visualization. Figure 4 shows the speed and power in the upper chart. When the motor is loaded, the speed decreases (green curve), while the power consumed increases (grey curve). Also, the current spectrum (blue), the current trace (red), and the parameters (table) are displayed numerically in this interface.
For references, demo programs and questions you can always contact us at info@gantner-instruments.com.
More articles
Wendelstein 7-X Stellarator
After 9 years in construction, the stellarator (nuclear-fusion machine) of the Max Planck Institute in Greifswald generated plasma for the first time on December 10, 2015. The reactor had been gradually ramped up over the past 12 months. The event was given extensive coverage in the media. Gantner Instruments specially developed sensors for temperature and strain measurement for the project, which are otherwise unavailable on the market.
Read more...The 10 most important principles for effective acceleration measurement and vibration monitoring
In vibration monitoring and acceleration measurement, there are many variables to consider, and many opportunities to make mistakes. Sometimes it is nice to have a checklist that keeps you on the right track. Here are the 10 essentials for effective vibration monitoring and acceleration measurement
Read more...PowerUp EV: Virtual Business Meet on EV Technology
Join us for PowerUp EV, a virtual business meet dedicated to exploring the latest advancements and trends in Electric Vehicle (EV) technology. Organized by Smart Energy Magazine the event is cosponsored by Gantner Instruments, a leading provider of testing solutions for the automotive industry, this event aims to bring together experts, professionals, and enthusiasts in the EV sector for insightful discussions and networking opportunities.
Read more...Changing demands within Automotive Testing – Webinar
Want to know more about changing demands within Automotive Testing?
Read more...