Vibration
Measurement
Interested in Vibration Measurement but don’t know what Gantner products are best for you? Our engineers can quickly help you personalize a Q.series X DAQ system around your needs.
Vibration measurement helps in diagnosing potential issues, predicting machinery failure, and ensuring structural integrity. This technical discipline involves the detailed acceleration measurement and analysis of mechanical oscillations to determine the condition and operational status of various systems. With advancements in sensor technology and analytical tools, vibration analysis has become an essential aspect of predictive maintenance strategies and performance optimization. The precise capture and actionable interpretation of vibration test data allow engineers to make informed decisions, extending the lifespan of equipment and structures while maintaining high safety standards. The integration of diverse vibration sensors, coupled with sophisticated data acquisition hardware, provides a comprehensive picture of vibrational forces at play. As we delve deeper into the specifics of vibration measurement, it’s clear that selecting the right sensors, applying advanced analysis techniques, and understanding the challenges of accurate vibration detection are key to effective monitoring and management.
Need Expert
Results Fast?
Interested in Vibration Measurement but don’t know what Gantner products are best for you? Our engineers can quickly help you personalize a Q.series X DAQ system around your needs.
Fundamentals of Vibration Measurement
Vibration measurement is the process of quantifying the mechanical oscillations of objects, machinery, or structures either in motion or stationary. At its core, this measurement aims to capture vibration data—specifically acceleration, velocity, and displacement—using various vibration sensors and transducers. This data is crucial for understanding the behavior of systems under stress or operational conditions. It allows for the early detection of potential failures, saving time, resources, and ensuring operational safety and efficiency.
Acceleration Measurement
The core of vibration analysis, acceleration measurement tracks the rate of change in velocity of an object. It provides vital insights into the dynamic behavior of machines and structures, often revealing critical conditions before they manifest as serious problems.
Types of Vibration Sensors
Several sensors are utilized in vibration measurement, each with specific applications and advantages. MEMS Sensors and IEPE Sensors are popular for their precision and range, offering solutions for a wide spectrum of environmental conditions. Piezoelectric (PE) sensors, known for their high-temperature resilience and broad measurement range, are indispensable in challenging conditions.
Frequency Measurement
The frequency components of vibration signals are used to identify and isolate sources of vibration. Techniques like FFT Analysis decompose vibrations into their constituent frequencies, enabling targeted diagnostic and corrective actions.
Vibration Analysis
Beyond collecting raw data, vibration analysis involves the sophisticated interpretation of collected signals to diagnose health, predict failures, and optimize performance. Advanced analytics can detect patterns that indicate wear, imbalance, misalignment, or other issues, often well before a visual inspection or other methods.
Sensor Technology in Vibration Measurement
Selecting the right sensor technology—MEMS, IEPE, or Piezoelectric (PE) sensors—enhances the precision and utility of vibration measurement. MEMS sensors are favored for their small size and low power use, IEPE sensors for easy integration and dynamic analysis, and Piezoelectric (PE) sensors for their resilience in high temperatures. The choice of sensor is informed by the specific demands of each measurement scenario, ensuring the best fit for the task.
MEMS Sensors
Micro-Electro-Mechanical Systems (MEMS) sensors are known for their compact size and ability to provide accurate acceleration measurements at a relatively low cost. They are particularly well-suited for embedded applications and can operate across a wide range of temperatures, making them versatile for both industrial and consumer products. MEMS Sensors excel in environments where space and power consumption are concerns.
IEPE Sensors
Integrated Electronics Piezo-Electric (IEPE) sensors are favored for their high signal-to-noise ratio and ease of use. They come equipped with built-in electronics, simplifying the measurement chain by eliminating the need for external charge amplifiers. Ideal for dynamic vibration analysis, IEPE Sensors are widely used in automotive testing, machinery monitoring, and aerospace applications.
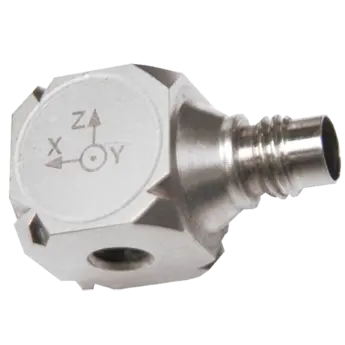
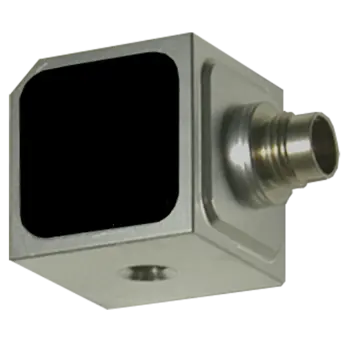
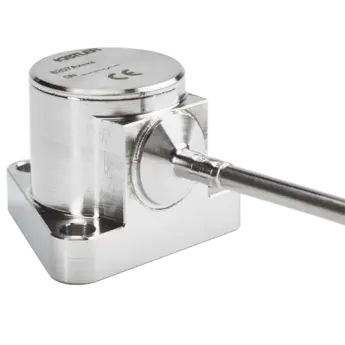
Piezoelectric (PE) Sensors
PE sensors are the choice for high-temperature applications where other sensor types might fail. They generate a charge in response to mechanical stress, and with their broad measurement range, they are indispensable for capturing high-intensity vibrations. Due to their robustness, PE sensors are frequently employed in power generation, process control, and materials testing.
Challenges in Vibration Measurement
The challenges of vibration measurement can range from environmental conditions to the inherent limitations of measurement technologies. Understanding these hurdles is key to implementing effective vibration monitoring strategies.
Environmental and Electrical Noise
A primary challenge in vibration analysis is differentiating between the actual vibration signals and noise. Environmental noise from surrounding machinery and electrical noise from other electronic devices can interfere with the signal, making accurate vibration measurement difficult. Techniques such as proper sensor placement and the use of noise-canceling vibration sensors and data acquisition hardware are employed to mitigate this issue.
Thermal Drift and Compensation
Thermal drift—the change in sensor output due to variations in temperature. This can skew the results of vibration tests, especially in environments with fluctuating temperatures. Vibration sensors like IEPE Sensors and MEMS Sensors, which offer built-in temperature compensation, and the use of charge amplifiers with PE sensors, help in addressing this challenge.
Sensor Alignment and Mounting
Failing to correctly mount and align vibration sensors can lead to erroneous data, affecting the overall vibration analysis. Use appropriate mounting accessories and ensure that sensors are properly aligned to the axis of vibration.
Frequency Measurement Range
Capture the full spectrum of vibration frequencies for a comprehensive analysis. Each sensor type has its own frequency response range. Selecting a vibration sensor and data acquisition hardware that can cover the required frequency range for the application ensures that no critical data is missed.
Data Management and Analysis
With the vast amount of data generated during vibration monitoring, efficiently managing and analyzing this data can be a significant challenge. Implementing data acquisition hardware and software solutions capable of performing FFT Analysis and other statistical functions turns raw data into actionable insights.
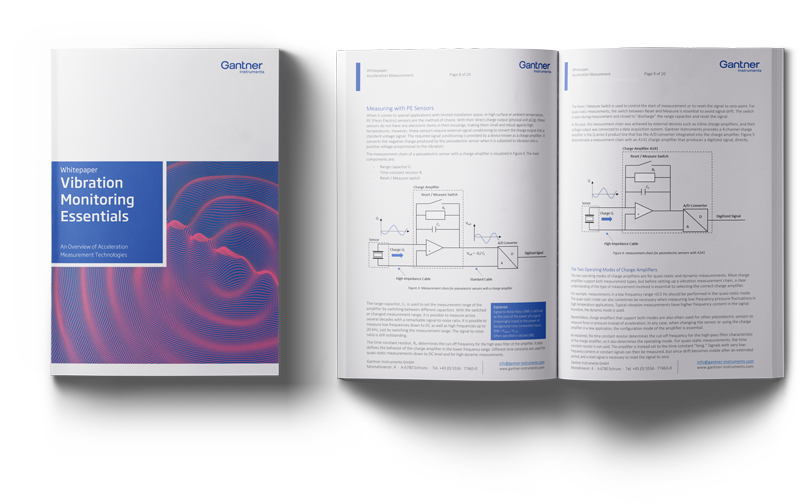
Want to measure vibration like an expert?
Download our free white paper to better understand how to pick the right vibration measurement sensor for an application.
You will also learn additional factors essential to achieving the best acceleration measurement results.
Applications of Vibration Measurement
Organizations across the following sectors can significantly reduce the risk of equipment failure, improve safety, and increase operational efficiency. The goal is not just to collect vibration data but to analyze and use it in a way that informs better decision-making and strategic planning.
Rotating Machinery Health Monitoring
One of the most common applications of vibration measurement is in monitoring the health of rotating machinery such as motors, turbines, and pumps. Vibration analysis here helps in detecting imbalances, misalignments, bearing wear, and other mechanical issues that could lead to failure.
Structural Integrity Assessment
Engineers use vibration tests to assess the structural integrity of buildings, bridges, and other constructions. This application often requires vibration monitoring sensors capable of capturing a wide range of frequencies to identify potential weaknesses or damages.
Automotive and Aerospace Testing
In the automotive and aerospace industries, vibration measurement is crucial for ensuring the reliability and safety of components and systems. IEPE sensors and MEMS sensors are extensively used for fatigue tests, crash tests, and engine vibration analysis to enhance vehicle performance and safety.
Energy Production and Process Control
In energy production, such as in power plants, and in process control settings, vibration analysis plays a vital role in maintaining operational efficiency and preventing unexpected downtime. Vibration sensors monitor critical components for signs of wear or failure, enabling proactive maintenance and repairs.
Research and Development
Vibration measurement is also pivotal in R&D for new product development and refinement. Here, detailed frequency measurement and acceleration measurement can provide insights into how designs perform under various conditions, leading to improvements in product durability and functionality.
How is Vibration Measurement used?
Vibration measurement is key for informed maintenance, design improvements, and safety checks for various applications. It enables the measurement of acceleration, velocity, and displacement, as well as vibration signal frequency analysis. Additionally, it’s used to determine material properties like stiffness, damping, and modulus of elasticity, alongside identifying natural or resonance frequencies.


AE
Measuring temperature in components of Hybrid Electric Drives
For our client, a well-known German engineering and technology market leader, we delivered the testing application solution for temperature measurements of components and new materials of hybrid electrical drives.
Click here to request
access to every
GI Application Example
Gantner Instruments' Solutions for Vibration Measurement
Our solutions are engineered to provide unmatched flexibility, connectivity, and support for all vibration monitoring applications:
- Flexible Integration: Adaptable hardware that connects with any sensor, tailored for any vibration testing requirement.
- Modern Connectivity: Leveraging APIs, fieldbus interfaces, and protocols like DDS for seamless system integration.
- Expert Assistance: Dedicated support to ensure your system is perfectly configured for your vibration analysis needs.
- Future Proof: Upward compatibility and extendable solutions with lifetime calibration support.
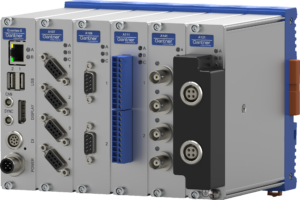
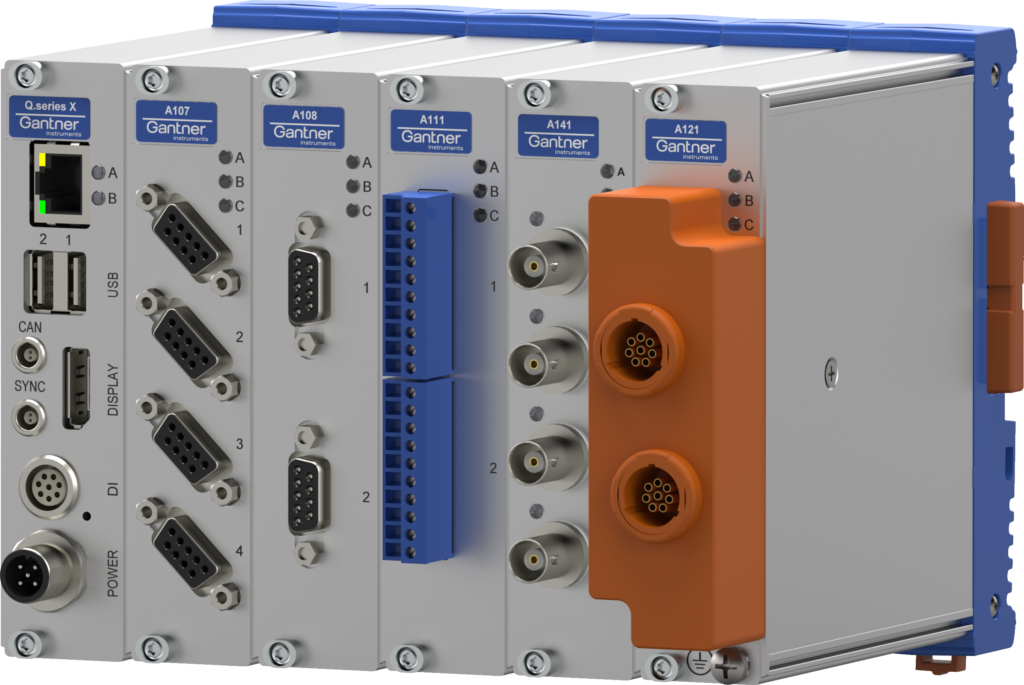
- For MEMS-based sensors with DB9 or MicroCom connectors
- Built-in 15 VDC sensor supply, galvanic isolated short circuit proof
- Input channels for single and tri-axis sensors with 20 kS/s sample rate and 2 kHz bandwidth
- Several configurable onboard filters
- For IEPE/ICP® based sensors with standard screw terminal or BNC connectors
- Built-in 4mA constant current source (lower current for high-temperature application on request), 22-26 V compliance voltage
- 4 galvanic isolated inputs with 100 kS/s sample rate and 0.5 Hz to 20 kHz bandwidth, 48 kHz bandwidth as an option
- Several configurable onboard filters
- High-precision amplifier for Piezoelectric sensors with Charge output (pC) with high-impedance BNC connectors
- Measurement range from 1,000 to 1,000,000 pC for static and dynamic measurements
- Four galvanic isolated inputs with 100kS/s sample rate and up to 20 kHz bandwidth
- Several configurable onboard filters
- For IEPE/ICP® based sensors on a high voltage potential up to 1200 VDC (e.g., on a Battery) with HV Lemo connectors
- Built-in 4mA constant current source
- Two galvanic isolated inputs with 100 kS/s sample rate and 0.5 Hz to 10 kHz bandwidth
- Several configurable onboard filters
+
+
+
+
Data Analysis and Interpretation in Vibration Monitoring
After the vibration sensors have collected the data, it’s the data acquisition hardware and software’s role to turn this data into actionable insights.
FFT Analysis for Frequency Domain Insights
Fast Fourier Transform (FFT) Analysis is used in vibration analysis to convert time-domain signals into the frequency domain. This reveals the vibration signal’s constituent frequencies, helping to identify and diagnose issues such as misalignment, imbalance, or bearing faults.
Trend Monitoring for Predictive Maintenance
By continuously monitoring vibration data, it’s possible to identify trends that indicate deteriorating conditions. This predictive maintenance approach allows for interventions before failures occur, significantly reducing downtime and maintenance costs.
Data Management and Visualization
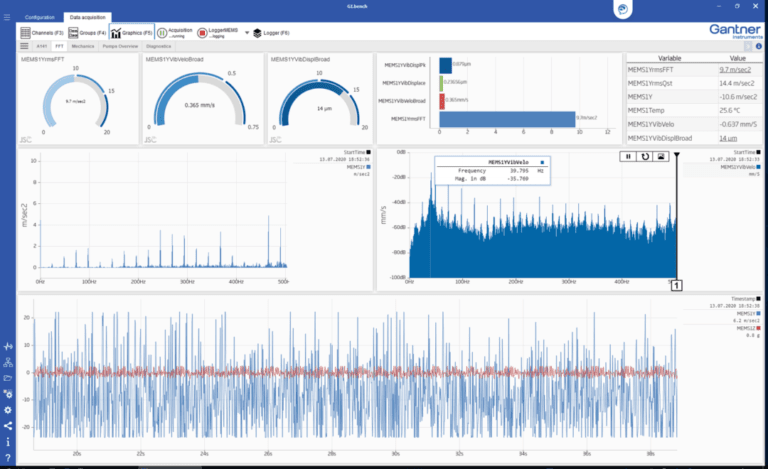
Advanced data acquisition systems provide comprehensive tools for managing the vast amounts of vibration data collected. Software solutions like GI.bench enable intuitive visualization, making it easier to interpret vibration analysis results and make informed decisions.
Statistical Functions and Alarm Management
Implementing statistical functions helps in understanding the overall health of the monitored system. Calculating RMS, peak, and other statistical parameters over time can highlight abnormal conditions, triggering alarms for immediate action.
Integration with Industrial Systems
The integration of vibration monitoring systems with broader industrial control systems enhances operational insights. This holistic approach ensures that vibration data contributes to the overall efficiency and safety of industrial operations.
Enhancing Vibration Analysis with Advanced Features
Gantner Instruments’ vibration measurement solutions empower you to conduct advanced analysis with features like FFT analysis, trend monitoring, and comprehensive data management through our GI.bench software. This enables not only data collection, but also insightful analysis for predictive maintenance and fault detection.
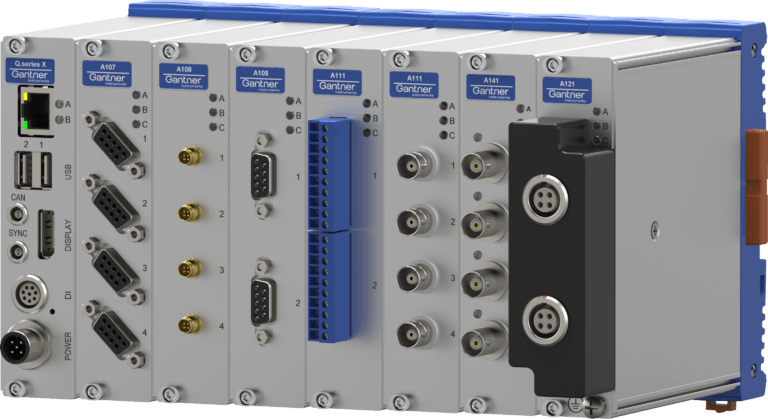
The Q.station X and GI.bench software offer advanced features for in-depth vibration analysis
FFT Analysis and Trend Monitoring
You can connect our Vibration Measurement I/O modules to the powerful data acquisition controller and smart edge device Q.station X. The Q.station X can evaluate the vibration data for you to reduce the number of stored data points and to announce warnings or alarms independently of any connected computer.
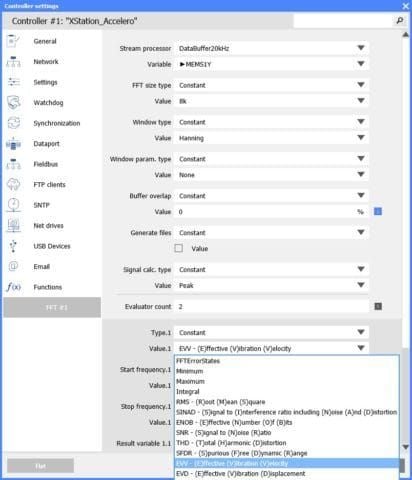
The following parameters can be calculated in the time domain:
- RMS
- Peak
- Peak-to-Peak
- Crest
- Kurtosis
These parameters are evaluated in the frequency domain:
- RMS (Spectral band, broad band)
- Vibration velocity
- Vibration displacement
- Max Amplitude @ Frequency
- FFT spectra
and many other trend parameters
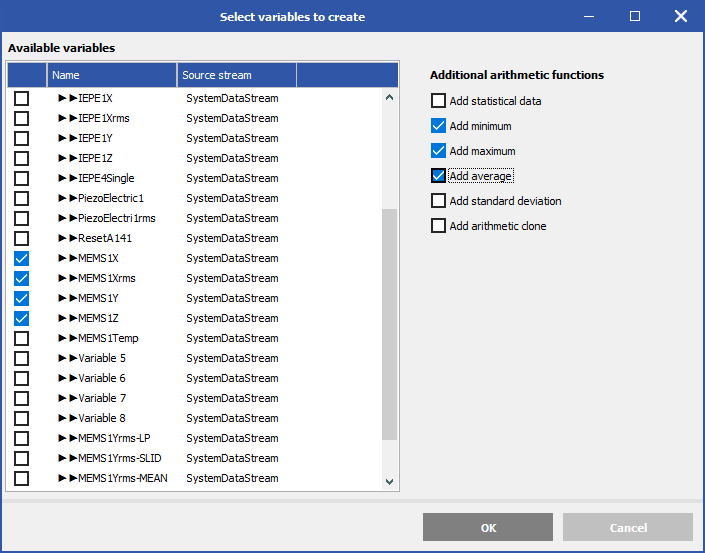
You can configure these parameters easily using arithmetic variables or the FFT settings in GI.bench. You can also use these parameters to trigger the storage of raw data with pre- and post-trigger conditions, which helps to keep data volume low because raw values are only stored in case something significant occurs.
For more information about Vibration Measurement I/O modules, take a look here.
Statistical Functions for Long-Term Analysis
Additional statistical functions such as maximum, minimum, average, and standard deviation are available for long-term trend analyses. With the help of these functions, trends can be formed from parameters such as RMS, peak value, or effective vibration velocity. The duration for calculating the statistics function can be set individually, e.g., the maximum RMS value over one minute.
Data Storage, Management, and Visualization
For data storage and visualization on the computer level, we offer our software GI.bench. This powerful and well-designed software is more than just a tool for configuring the measurement chain. It provides data storage and management capabilities, including merging data streams from different controllers or a redundant and scalable storage platform independent from any Windows-based user interface.
To visualize a large number of data points and provide overview dashboards, GI.bench underscores its strength. Intuitive drag-and-drop graphic elements such as YT / XY charts, gauges, bar graphs, bottoms, and sliders allow any dashboard to be configured in seconds. You can also apply channels from the measurement system or already evaluated variables to graphics elements via drag & drop. Pictures or video streams from IP cameras can be integrated into dashboards to show a perfect overview of the measurement setup.
Suppose you want to share measurement data with your team or need multiple screens to visualize all your data simultaneously. In that case, you can easily use any standard web browser to connect to the DAQ system and your view dashboards.
Who trusts Gantner for Vibration Measurement?


FAQ
These are frequently asked questions regarding our Vibration Measurement challenge:
Vibration is usually measured using an accelerometer – a sensor that outputs a signal proportional to acceleration. To measure vibrations, you attach the accelerometer securely to the vibrating object (or person/machine) and record the acceleration over time in units of m/s² (or in “g” where 1 g = 9.81 m/s²). Accelerometers are popular because their output can be mathematically integrated to get velocity or displacement if needed. In a typical setup, the accelerometer’s analog signal is digitized by a data acquisition device for analysis. The raw time-domain data (acceleration vs. time) can then be analyzed to determine vibration levels and frequency content. Often, an FFT (Fast Fourier Transform) is used to convert the time signal into a frequency spectrum, allowing identification of the dominant vibration frequencies. Other sensors exist (e.g., velocity transducers or proximity probes for displacement), but piezoelectric accelerometers are the most common due to their wide frequency range and ease of use. In summary: mount the sensor, record acceleration, then evaluate the amplitude and frequencies of vibration from that data.
Vibration is usually measured using an accelerometer – a sensor that outputs a signal proportional to acceleration. To measure vibrations, you attach the accelerometer securely to the vibrating object (or person/machine) and record the acceleration over time in units of m/s² (or in “g” where 1 g = 9.81 m/s²). Accelerometers are popular because their output can be mathematically integrated to get velocity or displacement if needed. In a typical setup, the accelerometer’s analog signal is digitized by a data acquisition device for analysis. The raw time-domain data (acceleration vs. time) can then be analyzed to determine vibration levels and frequency content. Often, an FFT (Fast Fourier Transform) is used to convert the time signal into a frequency spectrum, allowing identification of the dominant vibration frequencies. Other sensors exist (e.g., velocity transducers or proximity probes for displacement), but piezoelectric accelerometers are the most common due to their wide frequency range and ease of use. In summary: mount the sensor, record acceleration, then evaluate the amplitude and frequencies of vibration from that data.
The frequency of a vibration (in hertz, Hz) can be measured by analyzing the time period of the oscillation or by using spectral analysis. One straightforward method is to measure the time between successive peaks or cycles in the vibration signal – the reciprocal of this period gives the frequency (for example, if peaks are 0.1 s apart, the frequency is 10 Hz). However, vibrations often consist of multiple frequencies at once. Therefore, the common approach is to use an FFT on the accelerometer (or other sensor) data to produce a frequency spectrum. Peaks in the spectrum reveal the vibration frequencies present. Many vibration measurement systems or handheld vibration analyzers will directly compute and display the dominant frequencies. For rotating machinery, you might also use a tachometer to identify the rotational frequency and its harmonics. In short, by either timing the oscillation or using a frequency analyzer, one can determine the vibration frequency content.
Vibration is usually measured using an accelerometer – a sensor that outputs a signal proportional to acceleration. To measure vibrations, you attach the accelerometer securely to the vibrating object (or person/machine) and record the acceleration over time in units of m/s² (or in “g” where 1 g = 9.81 m/s²). Accelerometers are popular because their output can be mathematically integrated to get velocity or displacement if needed. In a typical setup, the accelerometer’s analog signal is digitized by a data acquisition device for analysis. The raw time-domain data (acceleration vs. time) can then be analyzed to determine vibration levels and frequency content. Often, an FFT (Fast Fourier Transform) is used to convert the time signal into a frequency spectrum, allowing identification of the dominant vibration frequencies. Other sensors exist (e.g., velocity transducers or proximity probes for displacement), but piezoelectric accelerometers are the most common due to their wide frequency range and ease of use. In summary: mount the sensor, record acceleration, then evaluate the amplitude and frequencies of vibration from that data.
Acceleration is the most commonly measured parameter for vibration because of both practical and analytical reasons. Practically, accelerometer sensors directly output acceleration, and they are readily available and robust. Analytically, acceleration emphasizes high-frequency components of vibration, which are often critical for detecting issues (since acceleration = ω² * displacement in sinusoidal motion, high-frequency, low-amplitude vibrations show up clearly in acceleration). Measuring acceleration provides flexibility: you can mathematically integrate the signal to obtain velocity or displacement if those are needed. Furthermore, many vibration severity criteria and human exposure standards are based on acceleration values. By contrast, measuring displacement would highlight low frequencies and could miss fast vibrations, and measuring velocity gives equal weight in a certain band (velocity is often used for machine vibration monitoring in the 10–1000 Hz range). Overall, acceleration is a comprehensive measure – it captures the full frequency range, and any other kinematic quantity can be derived from it. It’s for this reason that vibration is typically recorded in terms of acceleration and then converted or weighted as needed for specific analysis.
If the question is taken literally – for example, measuring mechanical vibrations of one’s body – one could use an accelerometer to measure specific vibrations (such as whole-body vibration on a platform, which might show a resonance in a few Hz range). This would give you specific mode frequencies (e.g., the body’s fundamental resonance around ~5 Hz in the vertical direction). So, if you meant a physical vibration frequency of a body or object, use appropriate sensors to measure oscillation.