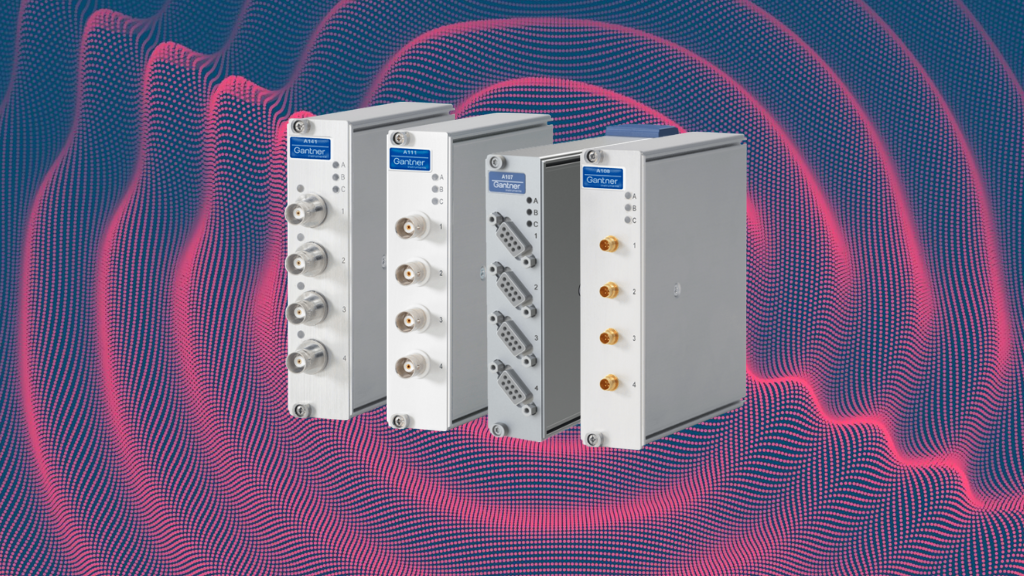
Gantner Instruments provides powerful I/O modules for every type of accelerometer with connectors compatible with most standard sensors, or you can adapt it to your needs.
Acquire data from MEMS sensors with the Q.series X A108-4M1 and A108-2M3 I/O module
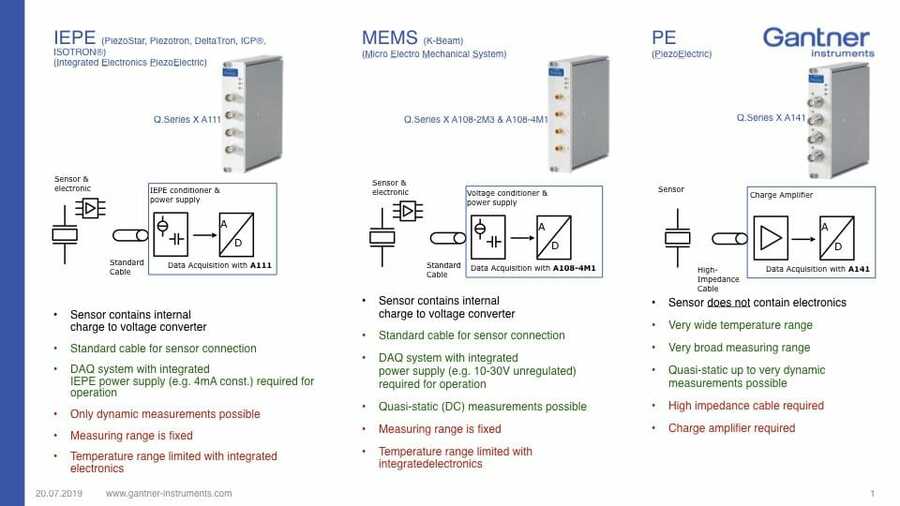
MEMS (Micro Electromechanical System) sensors are often used for low-frequency vibration measurements down to DC. These MEMS, also called K-Beam sensors, require a supply voltage for operation. The new Q.series X A107 and A108 module provides the sensor supply for convenient and straightforward setups. It is possible to connect up to 4 single-axis MEMS sensors to the A107-4M1 and A108-4M1.
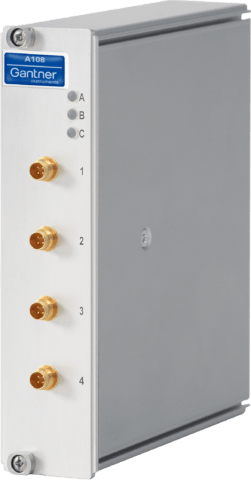
The A107-4M1 comes with standard DSUB 9-pole while the A108-4M1 module comes with standard 1/4-28 sockets (type Comtronic female, 4-pole). Furthermore, two tri-axis MEMS sensors can be connected to the A108-2M3 module via its DSUB 9-pole (female) sockets.
The A107-4M1, A108-4M1 and the A108-2M3 provide a galvanically isolated sensor supply voltage of +15 VDC a sample rate of 20 kHz per channel. While the four inputs of the A107-4M1 are differential, the sensor input types of the A108-4M1/2M3 are software selectable as either differential and single-ended. These A108 modules provide a single-ended input per sensor input that can be used, e.g., for temperature compensation. With this feature, measurement setups of the highest accuracy are possible.
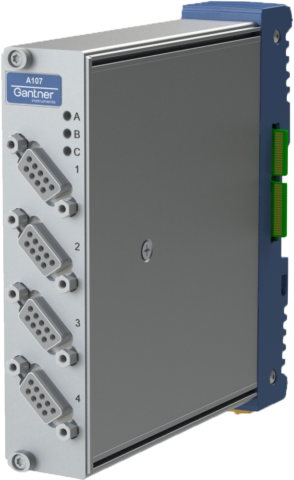
Connect IEPE / ICP® sensors to the Q.series X A111 I/O module
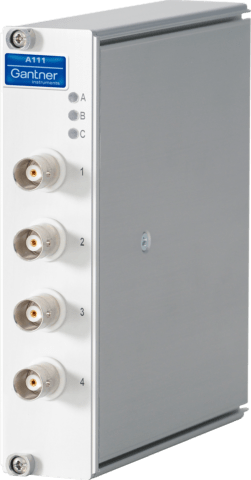
Do you have to set up a measurement chain with sensors based on IEPE (Integrated Electronics Piezo Electric), ICP®, ISOTRON®, DeltaTron, Piezotron, or PiezoStar (physical unit mv/g)? Our four channel A111 provides the right signal conditioning with sensor supply according to IEPE or ICP® standards. Each channel samples 100 kHz and is galvanically isolated from other channels, the power supply, and the bank for powerful filtering and evaluation on the I/O level and a maximum on robustness.
NOTE: A111 Module with higher bandwidth available upon request
The input frequency range of the A111 is limited to 20 kHz by the built-in anti-aliasing filter. This bandwidth is perfectly suitable for most IEPE sensors and guarantees aliasing free measurement signals.
However, if a higher frequency signal is required, e.g. for roller bearing analysis and monitoring with the shock pulse method (SPM), the A111-HB is available on request. In the shock pulse method, a special sensor is excited at its resonant frequency. This happens, for example, in a ball bearing or roller bearing when a ball hits the inner or outer race. The very weak pressure wave then generates a larger amplitude in the sensor in the range of it’s resonance frequency. Typical shock pulse sensors have a resonance frequency of 32 or 36 kHz. The A111-HB has a bandwidth of up to 45 kHz and is therefore suitable for shock pulse sensors. The HB version does not have an anti-aliasing filter.
For another high bandwidth application, an A111-HB module with extended measuring range is available. The A111-HB30 has an input range of ±30 V and no IEPE support. It is therefore ideal for reading the buffered output of machinery protection systems.
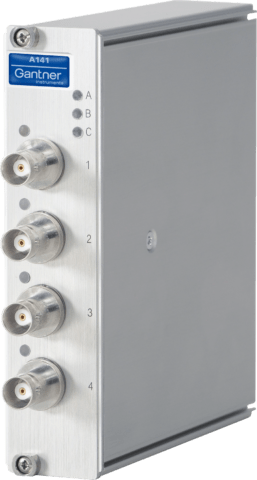
A141 Charge Amplifier for Piezo Electric sensors
When it comes to special applications with limited installation space, or high surface or ambient temperature, PE (Piezo Electric) sensors are the best choice. With their direct charge output (physical unit pC/g) these sensors do not have any electronic items in the sensor housing, making them small and robust against high temperatures. However, these sensors require external signal conditioning to convert the charge into a standard voltage signal. In the past, this conversion was achieved with external devices, e.g., inline charge amplifiers, and their output was connected to a data acquisition system.
With the Q.series X A141 charge amplifier, we provide a four-channel signal conditioning I/O module that covers the need for external devices.
Depending on the charge signal to be measured, you can choose between two modes for either fast transient and pulsating signals or almost static ones. Every time you are facing a broad measurement range, the A141 might be a perfect choice. Use it for measurement challenges involving accelerometers, force, or pressure sensors.
For a detailed understanding and comparison of the different sensors and signal conditioning technologies, have a quick look into our one-page overview.
You can connect all of these I/O modules to our powerful data acquisition controller and smart edge device Q.station X. The Q.station X can evaluate the vibration data for you to reduce the number of stored data points and to announce warnings or alarms independently of any connected computer.
The following parameters can be calculated in the time domain:
- Rms
- Peak
- Peak-to-Peak
- Crest
- Kurtosis
These parameters are evaluated in the frequency domain:
- RMS (Spectral band, broad band)
- Vibration velocity
- Vibration displacement
- Max Amplitude @ Frequency
- FFT spectra
- and many other trend parameters
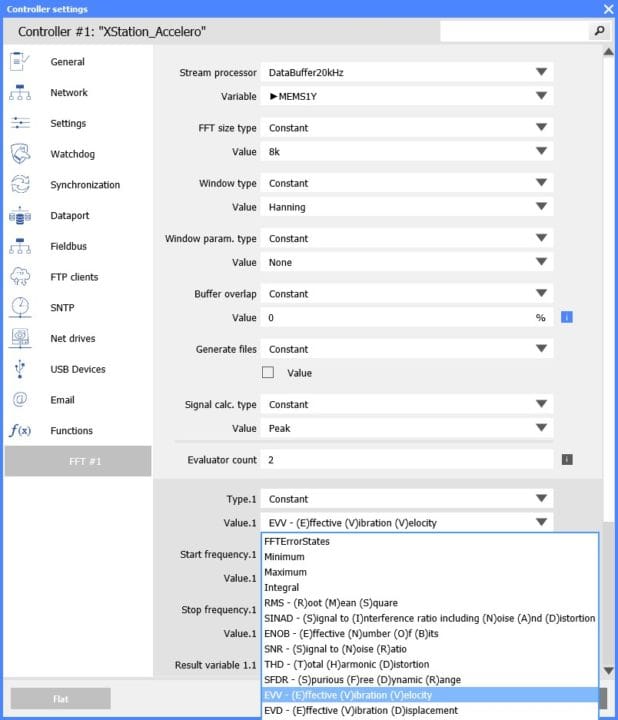
The configuration of the parameters is easily performed using arithmetic variables or the FFT settings in GI.bench.
All these parameters can be used to trigger the storage of the raw data with pre- and post-trigger conditions, which helps to keep data volume low, because raw values are only stored in case something significant occurs.
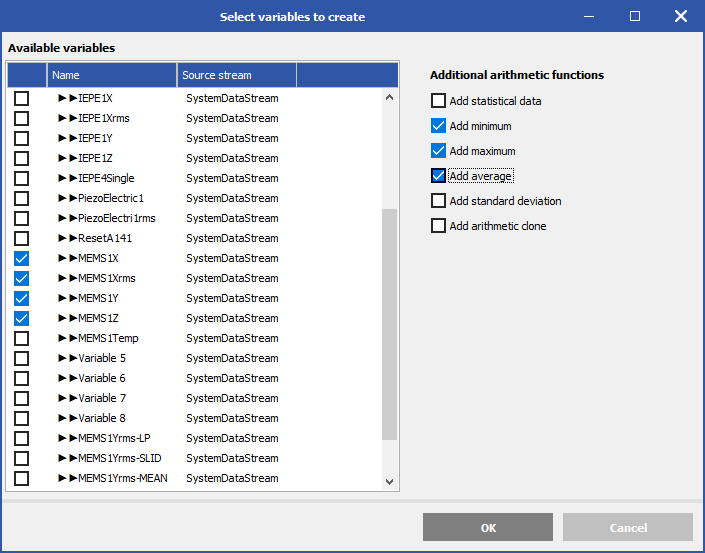
For long-term trend analyses, additional statistical functions such as maximum, minimum, average, and standard deviation are available. With the help of these functions, trends can be formed from parameters such as RMS, peak value, or effective vibration velocity. The duration for the calculation of the statistics function can be set individually, e.g., the maximum of the RMS value over one minute.
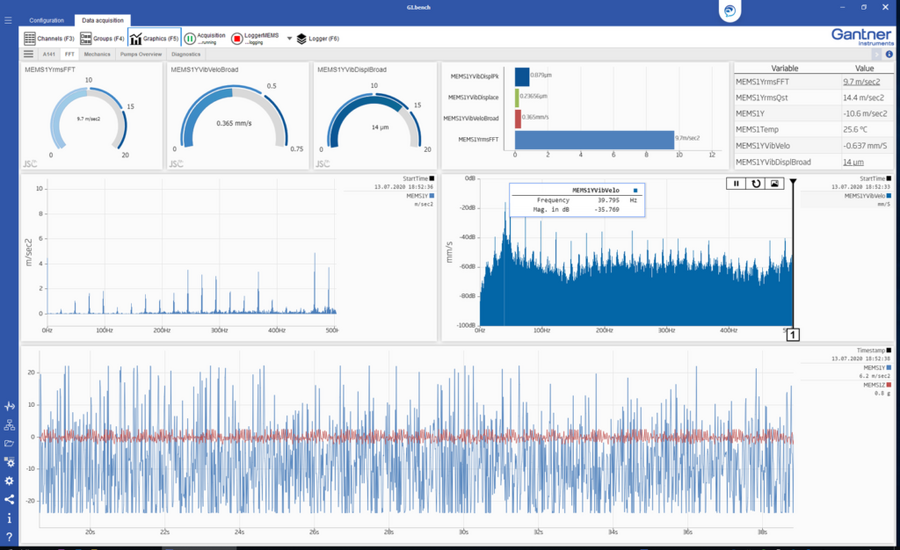
For data storage and visualization on the computer level, we offer our software GI.bench. This powerful and well-designed piece of software is more than just a tool for configuring the measurement chain. It provides data storage capabilities, including merging data streams from different controllers or a redundant and scalable storage platform independent from any windows based user interface.
But when it comes to how to visualize a large number of data points and provide overview dashboards, GI.bench underscores its strength. Easy to use drag & drop graphic elements such as YT / XY charts, gauges, bar graphs, bottoms, and sliders allow any dashboard to be configured in seconds. Channels from the measurement system or already evaluated variables can also be applied to graphics elements via drag & drop, and even pictures or video streams from IP cameras can be integrated into dashboards to show a perfect overview of the measurement setup. And if you want to share measurement data with your team or need multiple screens to visualize all your data simultaneously, you can easily use any standard web browser to connect to the DAQ system and your view dashboards.
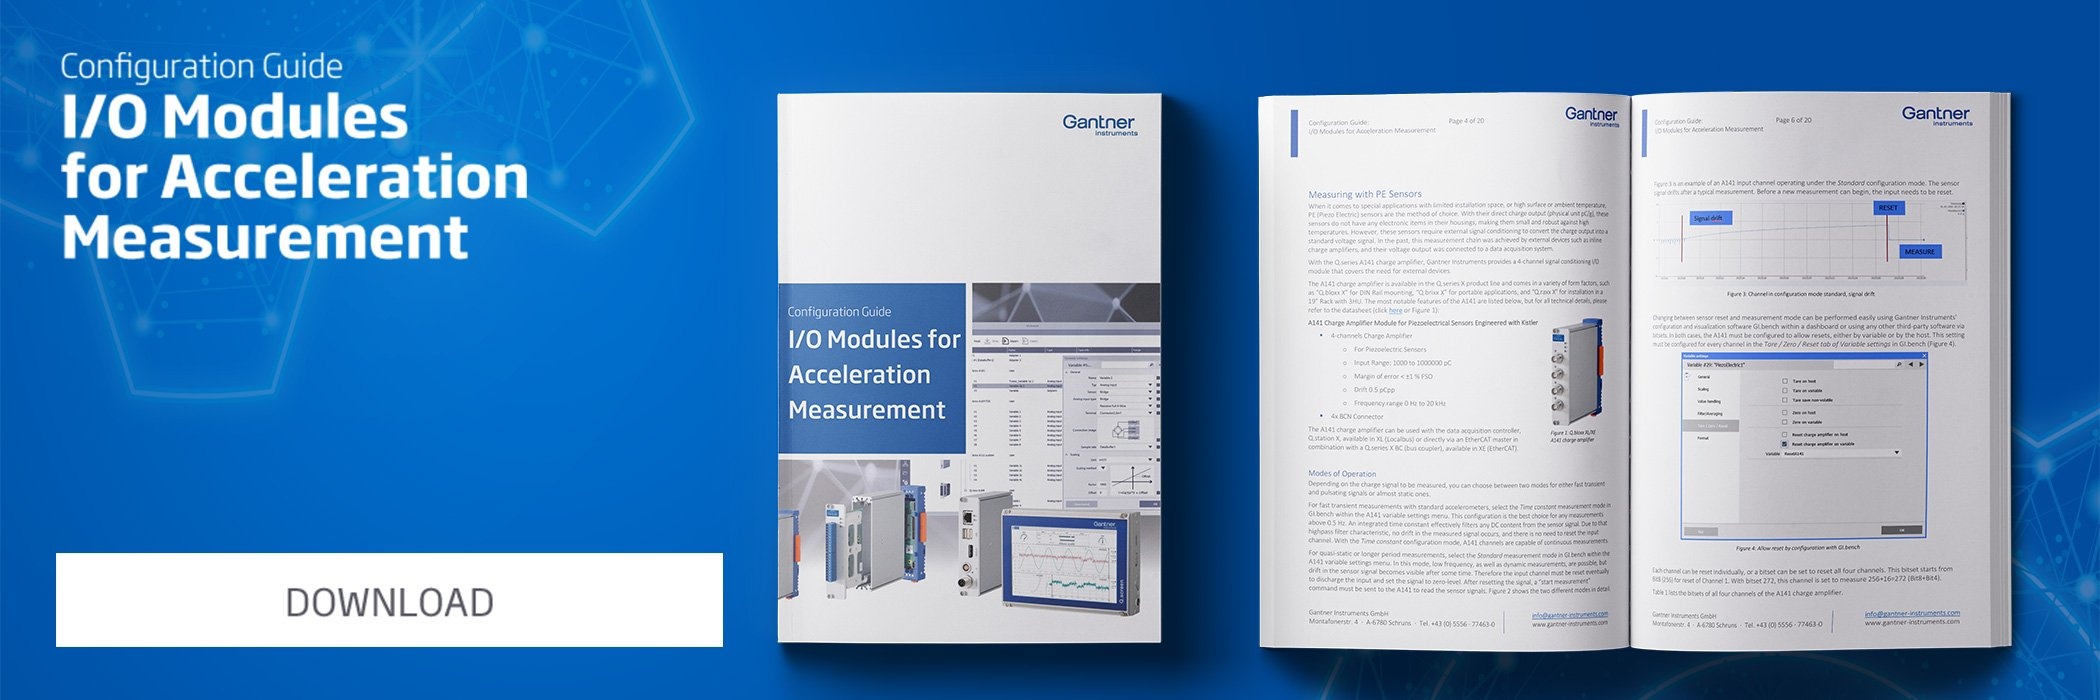
This guide provides a detailed overview of the Gantner Instruments DAQ modules
The vibration of an object, machine, or structure can be measured using different types of sensors, e.g., accelerometers, and depending on the sensor used, signal conditioning is either performed by the sensor or by the DAQ system.
So collecting quality vibration data requires not only the correct sensor for the job but also a quality DAQ system configured appropriately.
Download our step-by-step guide and keep it as a helpful reference for configuring any acceleration sensor element.
More articles
Korea Aerospace Industries selects Gantner Instruments for Structural Testing
Korea Aerospace Industries (KAI) has selected the Q.raxx slimline DAQ system from Gantner Instruments for static strength and fatigue evaluation testing of the LCH/LAH helicopter airframe, main landing gear, and engine mount structure.
Read more...Metro de Madrid Stays Ahead of Brake Problems
METRO DE MADRID is a railway company that provides public transportation services to Madrid and its metropolitan area. Currently, it is the most extensive metro network in Spain, with a length of 294 kilometers. With 302 stations, it is the third-largest network in Europe by kilometers, after those in London and Moscow. It has 2400 trains and makes an average of 650 million trips a year, with 350 million passengers.
Read more...The Aerospace Test & Development Show 2024
Join us from 10th to 11th September 2024 in Toulouse at the Aerospace Test and Development Show 2024 at booth 419. Register here for your free exhibition pass.
Read more...PowerUp EV: Virtual Business Meet on EV Technology
Join us for PowerUp EV, a virtual business meet dedicated to exploring the latest advancements and trends in Electric Vehicle (EV) technology. Organized by Smart Energy Magazine the event is cosponsored by Gantner Instruments, a leading provider of testing solutions for the automotive industry, this event aims to bring together experts, professionals, and enthusiasts in the EV sector for insightful discussions and networking opportunities.
Read more...