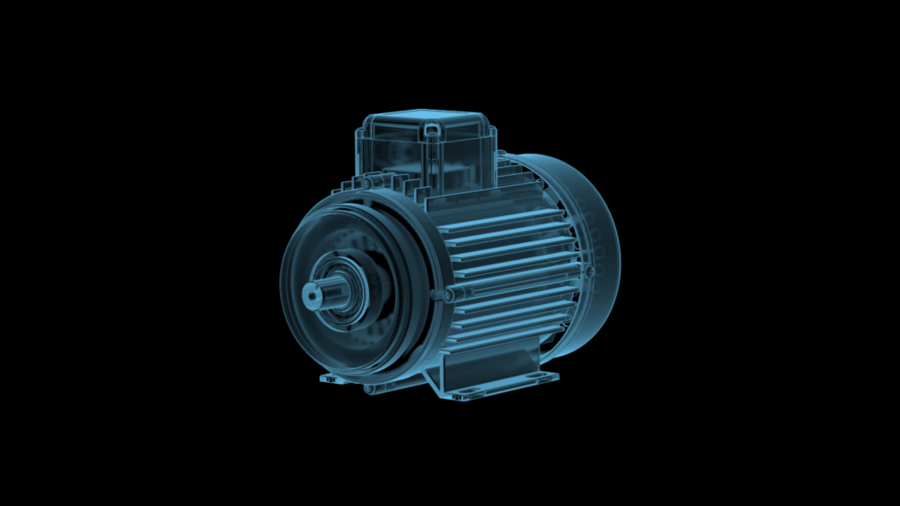
For the testing of these e-drives, we implemented the data acquisition solution and evaluation for a large German automotive supplier. Power consumption and speed are relevant to evaluating the efficiency of electromechanical systems. Since the motors are permanently installed into vehicle body parts, often only the electrical current and voltage signals are all that’s available for quality testing.
Using the Current Signal to Determine Motor Speed
In a classic DC motor, the mechanical commutator leads to a brief drop in the current curve when poles are reversed. Depending on the design and number of poles of the motor, the quantity of current dips corresponds to one revolution. This model is also reflected in the current curve of brushless motors with electronic commutation.
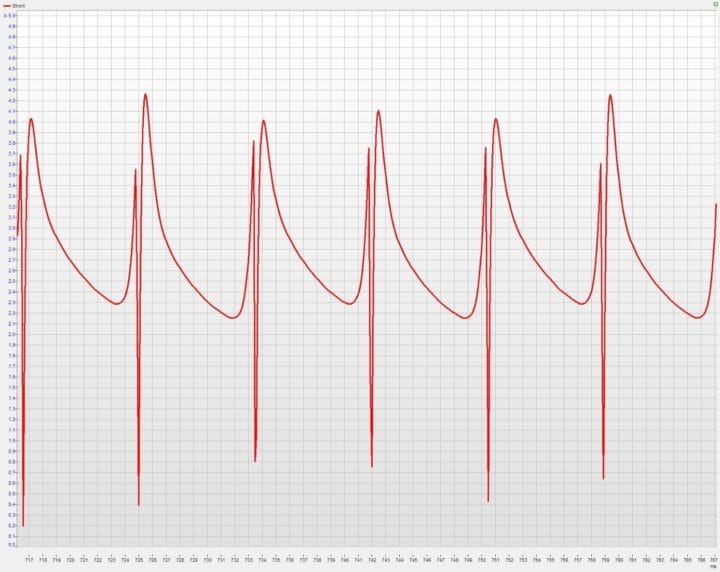
Figure 1 demonstrates the current curve of a motor over time. The current pictured here was measured with a Q.bloxx XL A107 I/O module and a shunt. The current drops visible in this example occur during commutation at intervals of 8.4 ms.
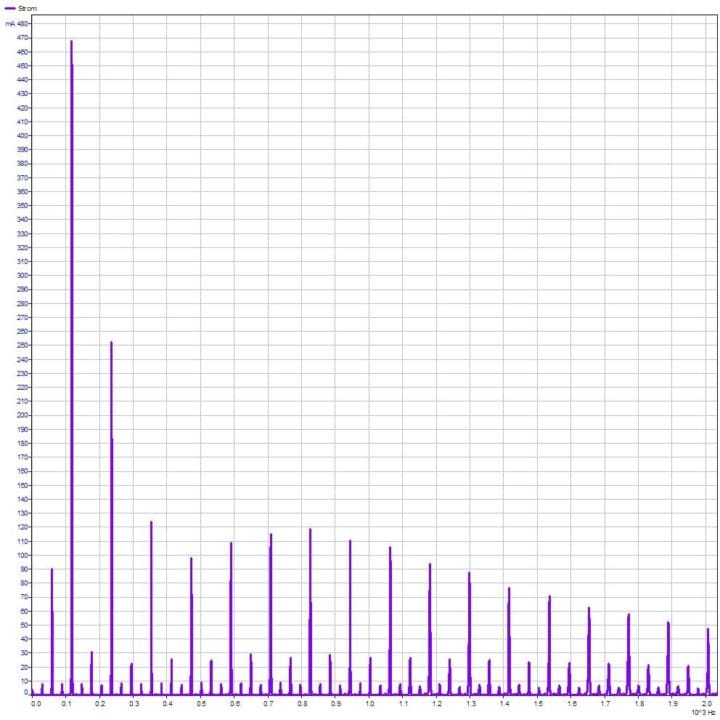
Accordingly, the spectrum of the current curve (Figure 2) shows its maximum occurs at 119 Hz. Assuming 3 commutations per revolution, this corresponds to a speed of 2380 revolutions per minute.
The spectrum can be performed both online and offline by Q.series X controllers. In this way, the engine speed can be determined continuously and live on the test bench using the current signal. The necessary configuration is performed in just a few steps.
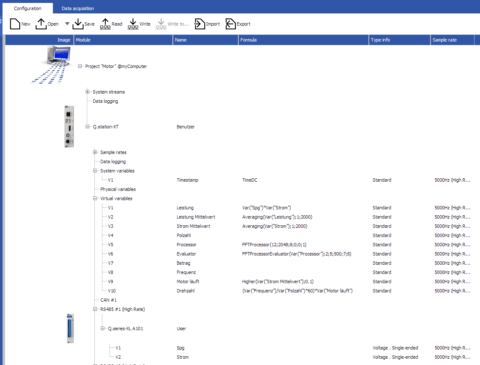
Quick-and-Easy Configuration on the Test Bench
The FFT function of the Q.series X controller offers, among other things, the possibility to evaluate the maximum of a spectrum within a selected frequency band by magnitude and frequency. The frequency of the maximum corresponds to the fundamental wave and is divided by the number of poles and multiplied by 60 to give the speed in revolutions per minute (rpm). Also, the current is used to detect whether the motor is in operation and whether the electrical power can be calculated.
This edge computing allows the motor speed to be determined without a separate computer.
Depending on the test bench configuration, data can now be transferred to the system control, e.g., via EtherCAT or visualized within GI.bench on the test bench PC or over the local network.
Simply Powerful Visualization
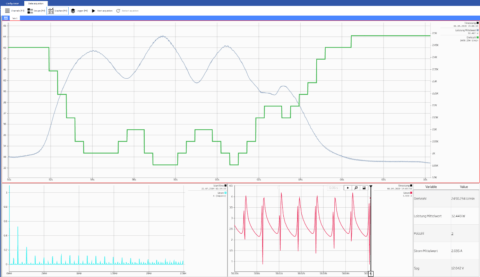
With GI.bench, you can create custom dashboards for visualization. Figure 4 shows the speed and power in the upper chart. When the motor is loaded, the speed decreases (green curve), while the power consumed increases (grey curve). Also, the current spectrum (blue), the current trace (red), and the parameters (table) are displayed numerically in this interface.
For references, demo programs and questions you can always contact us at info@gantner-instruments.com.
More articles
Systèmes d’acquisition de données portables et mobiles
De nombreuses raisons justifient un système de mesure flexible et robuste qui doit être facile à transporter pour collecter des données de mesure à différents endroits. Il peut s'agir, par exemple, de mesures à court terme sur des machines ou des composants d'usine lors de la mise en service après un entretien, ou de mesures récurrentes sur des ponts ou d'autres ouvrages d'art.
Read more...Integrate Gantner Instruments with NI LabVIEW
The easiest way to connect Gantner DAQ to your LabVIEW environment—now better than ever. Gantner Instruments understands the needs of engineers working across R&D, testing, and industrial automation. That’s why we’ve made it easier than ever to connect our modular, high-precision data acquisition systems, Q.series and Q.series X, with one of the most widely used engineering platforms: NI LabVIEW.
Read more...Easy integration of Gantner Instruments product platforms into NI LabVIEW
NI LabVIEW has become an essential graphical programming environment widely used in engineering, R&D, testing, and industrial automation. Its flexibility allows engineers to quickly integrate and control diverse measurement hardware, streamlining the entire data acquisition process.
Read more...New Monitoring Solution – Q.series Portable
For short-term or rout-based condition monitoring of various assets we now provide a portable system solution. Our new Q.series Portable based on Q.station 101 and OEM-boards for analog and digital inputs contained in a robust transport case is fully engineered and ready to use ‘out of the box’. The electronic boards and the power supply system are mounted on shock absorbers to withstand heavy-duty work under harsh environments in the field.
Read more...