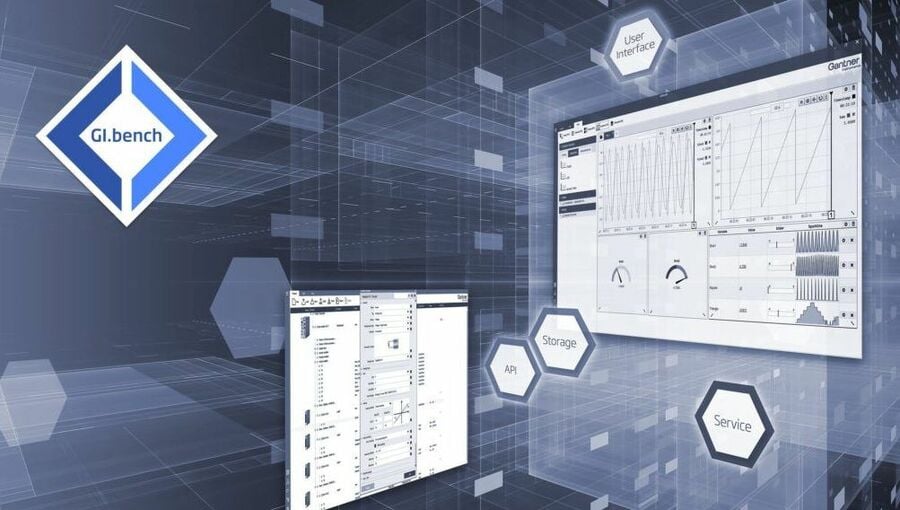
We are therefore excited to announce the release of GI.bench.
Faster, more intuitive, and more user-friendly than ever before
We strongly believe data acquisition software should be fun. With this in mind, we have polished the user interface to improve the look and feel. The data dashboards are now more intuitive and easier to work with. On top of that, we have made some outstanding improvements under the hood to make the software faster for setting up high-channel-count data acquisition projects. And as always, we worked on improving the stability issues flagged by our users.
GI.bench benefits you’re missing out on
- Faster system configuration in just a few clicks.
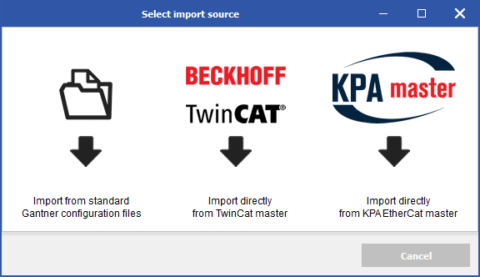
With the improved Read function, the software scans your network, and the selected controller is read in automatically. You can select multiple channels, change them all to their respective signal type and scaling, or select predefined sensors from our sensor database. Within a few clicks, your channel setup is completed and ready to show on your browser.
- To reduce the setup time of large-channel count data acquisition projects,
we have added the option to copy and paste settings of I/O modules and individual variables. It is now also possible to import and export the project configuration to CSV file format for use with Excel, Python, or other third-party editing software.
- It is really that easy to see and log your signals.
It was never easier to log data with different sampling frequencies in a single file. Data from different controllers or with different sampling frequencies can be combined in a Merged Datastream for logging. The integration of third-party systems is also possible by using the enhanced stream settings in a GI.bench project.
- Data visualization and storage on demand.
It is just a click further to visualize all signals in a list with a numerical value, bar chart, and error indication. Visualization via the “Quick View” YT-Chart and logging of signals on your local computer’s hard drive is also just a click away.
- Together with the new crisp look and feel, we have implemented a Basic and Expert mode.
With this ‘less is more’ approach, we avoid overloading the user interface with settings that may not be applicable for your day-to-day work.
- We have extended our library of charts and other elements for data visualization.
New design tools and grid templates will make it easier for you to create visually stunning data dashboards. On top of that, it is now possible to export the data from your chart to standard industry file formats, like CSV, UDBF, FAMOS, and MDF.
- We have introduced Enhanced Datastreams for automatic data pre-processing on your PC.
Create project-specific virtual variables for pre-processing your measurement data directly in GI.bench. The virtual variables come with a library of arithmetic functions, including advanced filtering options (low, high, and band-pass) and signal integration (e.g., to convert acceleration data to vibration velocity).
- PC-based data logging just became more comfortable.
With new interactive buttons to start and stop data loggers. The buttons are directly available from the toolbar so you can control your data loggers while viewing your dashboards.
- It is now possible to use FFT charts to display logged data directly in your data dashboard.
Historical log file data can be combined with live measurement data in the same dashboard.
- We value our system integrators.
To make their job easier, we have added the possibility to create CAN DBC files and EtherCAT Slave Information (ESI) files directly from the GI.bench user interface. Also, Modbus configuration is now more user-friendly.
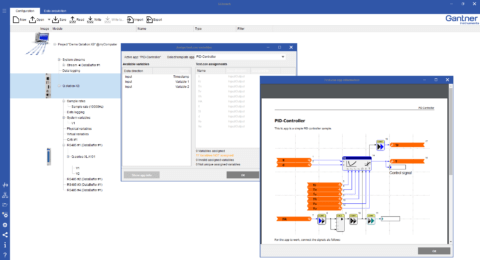
- For your advanced control and automation tasks,
we have extended the number of pre-engineered test.con apps directly available for use in GI.bench, including several function generators and a PID control loop. If no app is available for your application, do not worry, you can easily create your own test.con app!
- An excellent user interface does not need an explanation.
With that said, some expert engineering settings require some background information. To make that information easily accessible, we have embedded an extensive online help in our new release.
More articles
PV & Grid Integration Symposium
Meet us at the 2019 PV Systems Symposium, the leading industry get together for PV Monitoring and grid integration in Albuquerque (New Mexico), United States.
Read more...Gantner Instruments delivers DAQ system to the Technical University of Denmark – DTU
Gantner Instruments is proud to announce that is has delivered it’s Q.series Data Acquisition System to the Technical University of Denmark (DTU) for their Villum Center for Advanced Structural and Material Testing (CASMaT). The center is a collaboration between DTU Civil Engineering, DTU Mechanical Engineering and DTU Wind Energy with the objective to strengthen experimental research in mechanics of structures and materials. A large donation from VILLUM FONDEN made it possible to establish the center.
Read more...Bridge Monitoring: The Cornerstone of Tomorrow’s Sustainable Infrastructure
A modern infrastructure enables us to organize mobility more sustainably, transport goods and commodities in a climate-friendly way and take advantage of the opportunities offered by digitization. Doing without it is not an option.
Read more...TestRig Symposium
The two-day TestRig symposium presents the current state of the art, future-oriented developments and outstanding case studies in the field of test rig construction and operation, and promotes the personal exchange of experience. The symposium will be complemented by an accompanying exhibition.
Read more...