The electric vehicle testing community is having to deal with increasingly complex products and faster development cycles, meaning that test labs are under constant pressure. As such, the ability to efficiently analyze test data has never been more critical. Costs must be kept as low as possible, while growing amounts of data from sensors are processed. Engineers must monitor and analyze test data in real time, regardless of how much there is to sift through. It’s therefore no wonder that they are seeking new ways to improve testing efficiency and reduce risk of low quality data.
During acquisition, electrical and mechanical signals are measured at sample rates in the kilohertz range and need to be highly synchronized. These tests in particular generate an overwhelming amount of data. The real challenge is storing and preserving this data. The handling of such large volumes of structured and unstructured data requires an adaptive and scalable data back end. To cope with ever-changing requirements, setup configurations, parameter extensions and sample rates, a separation between hot and cold datais helpful.
‘Cold data’, which is less frequently accessed and only needed for auditing or post-processing, is stored in a distributed streaming platform that scales as needed. The ‘hot data’, which is accessed in real time for analysis, is provided in a NoSQL time-series database. This database stores readings securely in redundant, fault-tolerant clusters. Flexible data aggregation ensures that the right granularity is available at any time. Data can then be replayed and aggregated in different ways for detailed analysis of test events. This approach minimizes IT operational costs and the storage infrastructure within the test lab.
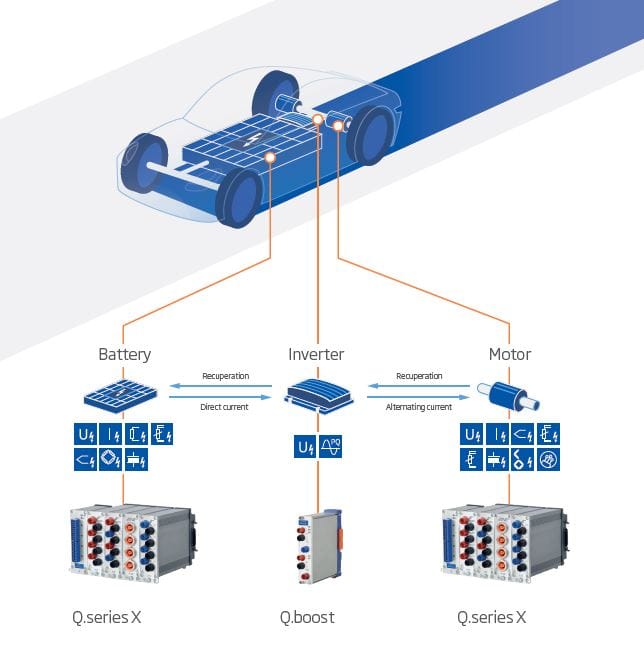
Electric vehicle powertrain testing is a typical use case where a scalable data back end offers significant advantages. A huge quantity of data is generated, especially during real-time power and electric motor performance evaluation. Data rates can vary from 10 samples/sec up to 4,000,000 samples/sec. The challenge is storing all this data, while keeping it available on a 24/7 basis for rapid analysis of continuous and triggered data streams.
To capture, analyze and store data, and ensure its availability for applications, Gantner selected Apache Kafka, a data streaming platform, to manage cold data; and the distributed database, CrateDB, to handle hot data. Working with this scalable data back end concept demonstrates the power of combining edge computing, big data handling, and machine learning.

Test labs use specialized control, monitoring and data acquisition systems, but often lack the necessary integration between these systems, which can lead to late fault detections in systems under test. Gantner’s philosophy is to provide customers with open interfaces to store data and send it wherever they need – enabling seamless integration with any monitoring, analysis and reporting tool.
For test labs outfitted with automated test systems, the company’s Application Programming Interface (API) provides a simple way of integrating the solution into their existing environments. Analysis and fault detection methods differ by application, so standardized interfaces for integrating with existing architectures, visualization methods and report routines are essential; for example, to accurately calculate power factor, apparent power, and reactive power from raw measurement data.
With an adaptive and scalable data back end solution, Gantner Instruments provides test labs with the platform needed to grasp, monitor, analyze and react to any physical data in real time, regardless of the data volume – transforming data directly into insights.
Experience the new platform for modern and robust measurement setups
The GI.bench software platform combines faster test setups, project configuration and handling, as well as visualization of data streams in one digital workbench. It enables you to configure, execute and analyze your measurement and test tasks on the fly. Access live and historical measurements data anywhere.

More articles
Innovation Call with CEO Werner Ganahl of Gantner Instruments
State funding for seven future digital projects The best digital innovation projects in Vorarlberg have been sought and funded. Seven projects are receiving a total of 130,000 euros in state funding.
Read more...Gantner Instruments appoints Bienfait as new Business Partner in the Netherlands
Gantner Instruments is pleased to announce that is has appointed Bienfait B.V. as business partner in the Netherlands. Bienfait will support Gantner Instruments’ entire portfolio of test and measurement solutions. The appointment provides stronger local support for the country’s rapid growth in key sectors like high-tech systems, energy, water and advanced composite materials.
Read more...Bridge Excitation and Measuring Range with Strain Gauge
Strain gauge bridges provide signals that depends on bridge excitation. Therefor the bridge signal is expressed in mV/V (ratiometric measurement).
Read more...How to get insight into your measurement data with online dashboards in 3 steps
Data empowers engineers across sectors to improve their processes, initiatives, and innovations using the power of insight. The ability to monitor and respond to data from an increasing number of sensors can seem like a minefield. Data dashboards have evolved as one of the essential tools for professional engineers to get a grip on their measurement data.
Read more...