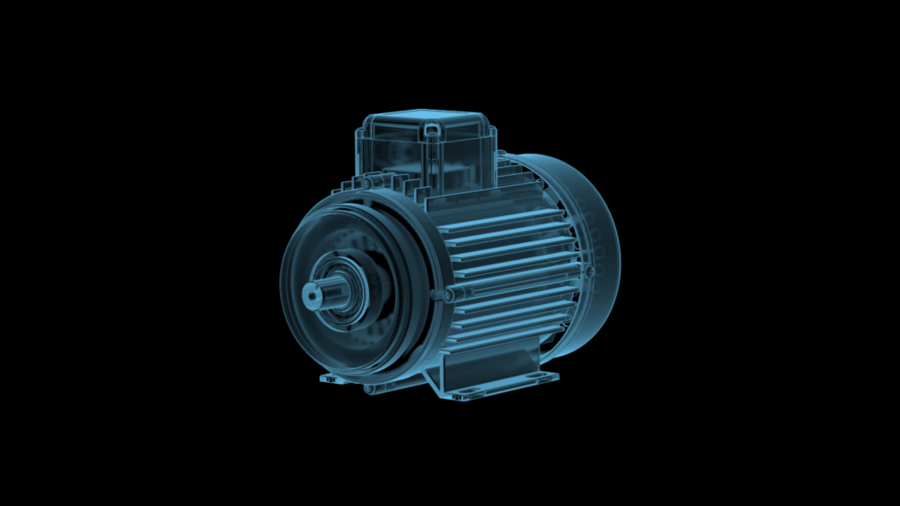
For the testing of these e-drives, we implemented the data acquisition solution and evaluation for a large German automotive supplier. Power consumption and speed are relevant to evaluating the efficiency of electromechanical systems. Since the motors are permanently installed into vehicle body parts, often only the electrical current and voltage signals are all that’s available for quality testing.
Using the Current Signal to Determine Motor Speed
In a classic DC motor, the mechanical commutator leads to a brief drop in the current curve when poles are reversed. Depending on the design and number of poles of the motor, the quantity of current dips corresponds to one revolution. This model is also reflected in the current curve of brushless motors with electronic commutation.
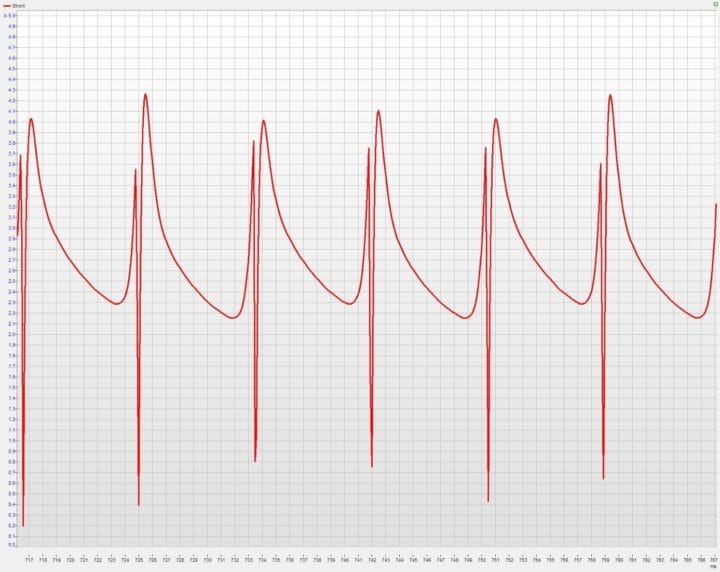
Figure 1 demonstrates the current curve of a motor over time. The current pictured here was measured with a Q.bloxx XL A107 I/O module and a shunt. The current drops visible in this example occur during commutation at intervals of 8.4 ms.
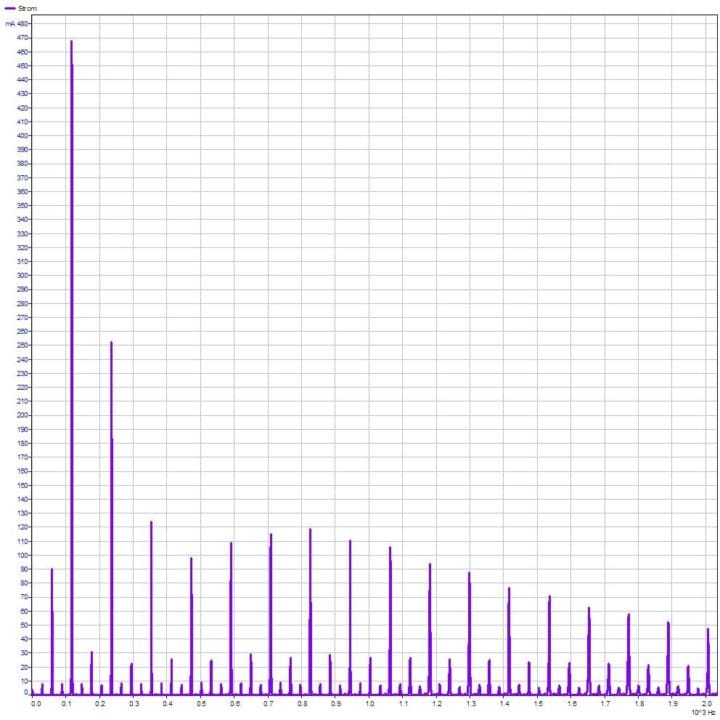
Accordingly, the spectrum of the current curve (Figure 2) shows its maximum occurs at 119 Hz. Assuming 3 commutations per revolution, this corresponds to a speed of 2380 revolutions per minute.
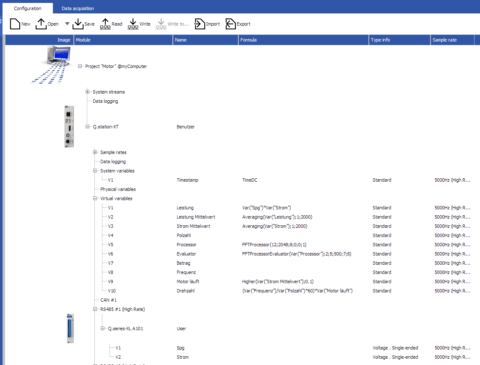
The spectrum can be performed both online and offline by Q.series X controllers. In this way, the engine speed can be determined continuously and live on the test bench using the current signal. The necessary configuration is performed in just a few steps.
Quick-and-Easy Configuration on the Test Bench
The FFT function of the Q.series X controller offers, among other things, the possibility to evaluate the maximum of a spectrum within a selected frequency band by magnitude and frequency. The frequency of the maximum corresponds to the fundamental wave and is divided by the number of poles and multiplied by 60 to give the speed in revolutions per minute (rpm). Also, the current is used to detect whether the motor is in operation and whether the electrical power can be calculated.
This edge computing allows the motor speed to be determined without a separate computer.
Depending on the test bench configuration, data can now be transferred to the system control, e.g., via EtherCAT or visualized within GI.bench on the test bench PC or over the local network.
Simply Powerful Visualization
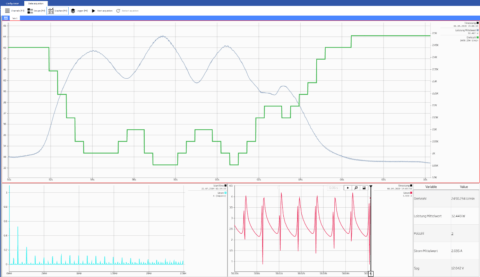
With GI.bench, you can create custom dashboards for visualization. Figure 4 shows the speed and power in the upper chart. When the motor is loaded, the speed decreases (green curve), while the power consumed increases (grey curve). Also, the current spectrum (blue), the current trace (red), and the parameters (table) are displayed numerically in this interface.
For references, demo programs and questions you can always contact us at info@gantner-instruments.com.
More articles
One-Click Cloud Connectivity – Real-Time DAQ in the Cloud
Historically, connecting your data acquisition (DAQ) system to the cloud involved complex networking setups, manual configurations, and tedious coding. With GI.bench, cloud integration is now seamless—pair your controller to GI.cloud with one click, making secure, remote data access easier than ever before.
Read more...Bridge Monitoring: The Cornerstone of Tomorrow’s Sustainable Infrastructure
A modern infrastructure enables us to organize mobility more sustainably, transport goods and commodities in a climate-friendly way and take advantage of the opportunities offered by digitization. Doing without it is not an option.
Read more...Turbomeca Chooses the Q.series
Turbomeca is a french manufacturer of compressors and turbines for the aviation industry, among its customers Eurocopter, Augusta und Sikorsky. For the test and measurement design of future test stands were the products from four manufacturers tested, and the companies rated on quality in production, and in all functional processes. Turbomeca selects Gantner Instruments GmbH as manufacturer and accredited according to strict rules. Gantner Instruments is exclusively represented by BGP Electronic in France.
Read more...TestRig 2026
The TestRig 2026 takes place on March 11–12, 2026, and is an interdisciplinary conference dedicated to the design and operation of modern test benches. It brings together experts from mechanical engineering, electrical engineering, sensor technology, actuators, and control and measurement systems. The focus is on test benches used to analyze vibration behavior, fatigue strength, and the reliability of technical systems.
Read more...