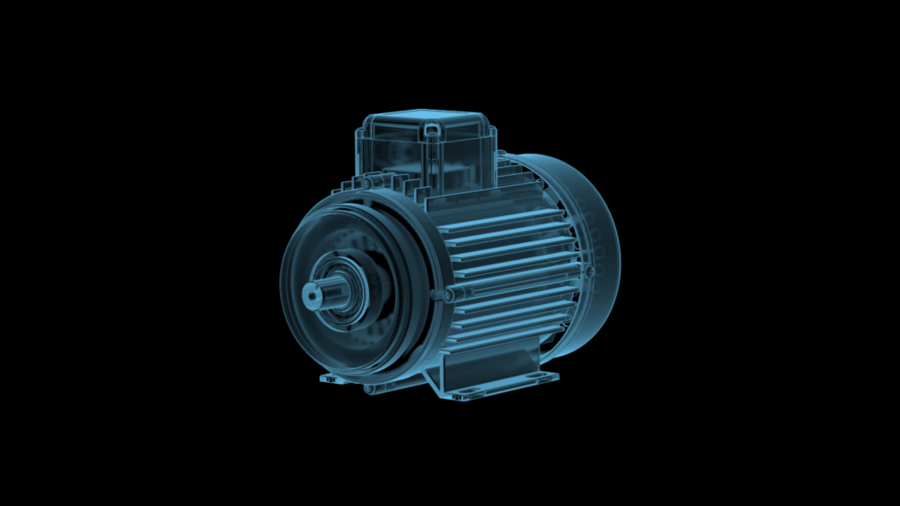
For the testing of these e-drives, we implemented the data acquisition solution and evaluation for a large German automotive supplier. Power consumption and speed are relevant to evaluating the efficiency of electromechanical systems. Since the motors are permanently installed into vehicle body parts, often only the electrical current and voltage signals are all that’s available for quality testing.
Using the Current Signal to Determine Motor Speed
In a classic DC motor, the mechanical commutator leads to a brief drop in the current curve when poles are reversed. Depending on the design and number of poles of the motor, the quantity of current dips corresponds to one revolution. This model is also reflected in the current curve of brushless motors with electronic commutation.
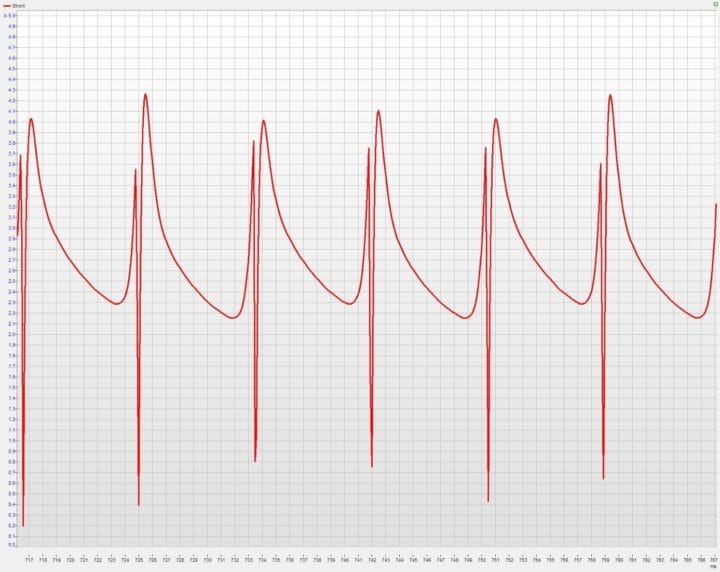
Figure 1 demonstrates the current curve of a motor over time. The current pictured here was measured with a Q.bloxx XL A107 I/O module and a shunt. The current drops visible in this example occur during commutation at intervals of 8.4 ms.
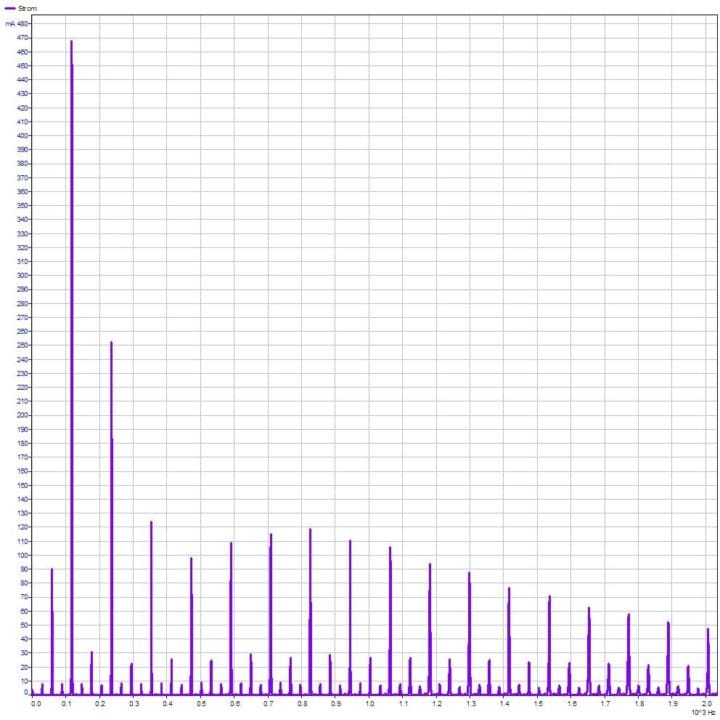
Accordingly, the spectrum of the current curve (Figure 2) shows its maximum occurs at 119 Hz. Assuming 3 commutations per revolution, this corresponds to a speed of 2380 revolutions per minute.
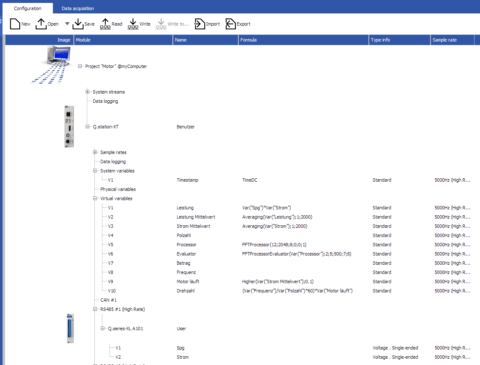
The spectrum can be performed both online and offline by Q.series X controllers. In this way, the engine speed can be determined continuously and live on the test bench using the current signal. The necessary configuration is performed in just a few steps.
Quick-and-Easy Configuration on the Test Bench
The FFT function of the Q.series X controller offers, among other things, the possibility to evaluate the maximum of a spectrum within a selected frequency band by magnitude and frequency. The frequency of the maximum corresponds to the fundamental wave and is divided by the number of poles and multiplied by 60 to give the speed in revolutions per minute (rpm). Also, the current is used to detect whether the motor is in operation and whether the electrical power can be calculated.
This edge computing allows the motor speed to be determined without a separate computer.
Depending on the test bench configuration, data can now be transferred to the system control, e.g., via EtherCAT or visualized within GI.bench on the test bench PC or over the local network.
Simply Powerful Visualization
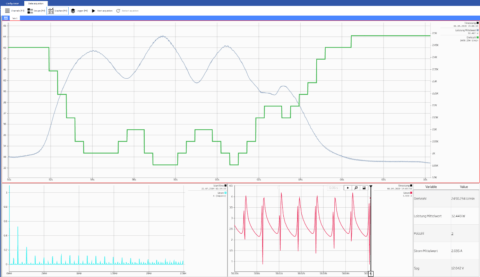
With GI.bench, you can create custom dashboards for visualization. Figure 4 shows the speed and power in the upper chart. When the motor is loaded, the speed decreases (green curve), while the power consumed increases (grey curve). Also, the current spectrum (blue), the current trace (red), and the parameters (table) are displayed numerically in this interface.
For references, demo programs and questions you can always contact us at info@gantner-instruments.com.
More articles
Huge Wind Turbine Blade Tests at BLAEST
The world’s longest rotor blade was manufactured by LM Wind Power in Denmark. Planning the test of the 290 ft (88.4 m) long rotor blade began in 2015. With BLAEST (the Blade Test Centre) Tests are now underway together in Aalborg, Denmark.
Read more...Automotive Testing Expo, China 2023
Prepare to elevate your automotive testing capabilities with Gantner Instruments at the Automotive Testing Expo China 2023!
Read more...GI.service Asset performance optimizer
With the significant investments being made in distributed renewable energies, the global energy market is changing from a central supply concept to a decentralized system. This transition is presenting companies in the energy market with various strategic and technical challenges to achieve efficient operations.
Read more...Webinar – Crate.io + Gantner Instruments: Real-time energy grid control based on big data
With the increase in renewable energy sources, the challenge for electric grid operators to keep grid frequencies stable has become even more significant. Constant data collection is essential for modern control technology and makes it possible to execute controls more quickly, whereby the use of smart grids can be further optimized.
Read more...